What is Average Directional Index?
Average Directional Index
 The Average Directional Index (ADX) is a technical analysis indicator used to measure the strength of a trend in a particular asset. The ADX is part of the family of trend-following indicators and is based on the Directional Movement Index (DMI).
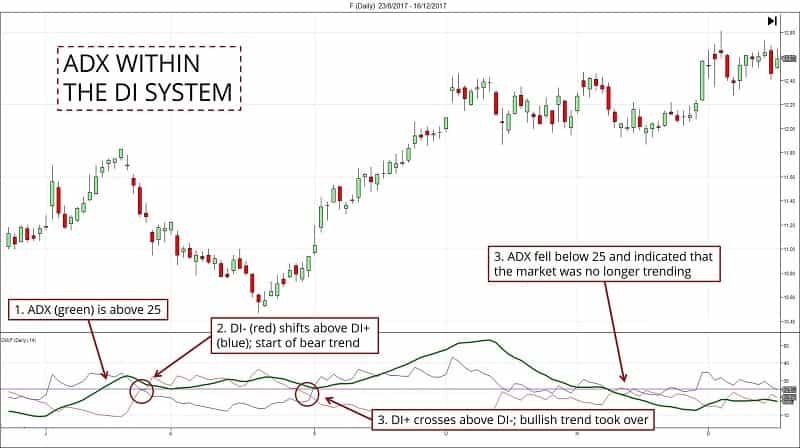
The ADX is calculated by taking the difference between two other lines in the DMI: the Positive Directional Indicator (+DI) and the Negative Directional Indicator (-DI). The ADX then measures the strength of the trend by comparing the difference between the +DI and -DI to the overall range of the asset`s price movement over a given period.
The ADX ranges from 0 to 100, with values below 20 indicating a weak trend and values above 40 indicating a strong trend. A value of 50 or higher may indicate an extremely strong trend.
Traders and investors can use the ADX to identify the strength of a trend and to determine whether it is worth entering or exiting a position. For example, if the ADX is trending upwards, this may indicate that the trend is gaining strength and that it may be a good time to enter a long position. Conversely, if the ADX is trending downwards, this may indicate that the trend is losing strength and that it may be a good time to exit a long position.
It is important to note that the ADX should not be used in isolation and should be used in conjunction with other technical analysis tools and indicators to confirm trading signals and identify potential market movements. |