Warning: Undefined array key "page_links" in /home/xuvjlsvj/domains/stockrishi.com/public_html/include/smarty/templates_c/%%77^77E^77EF9D85%%fr_free_stock_market_training.tpl.php on line 19
What is Bullish Flag Pattern?
Bullish Flag Pattern
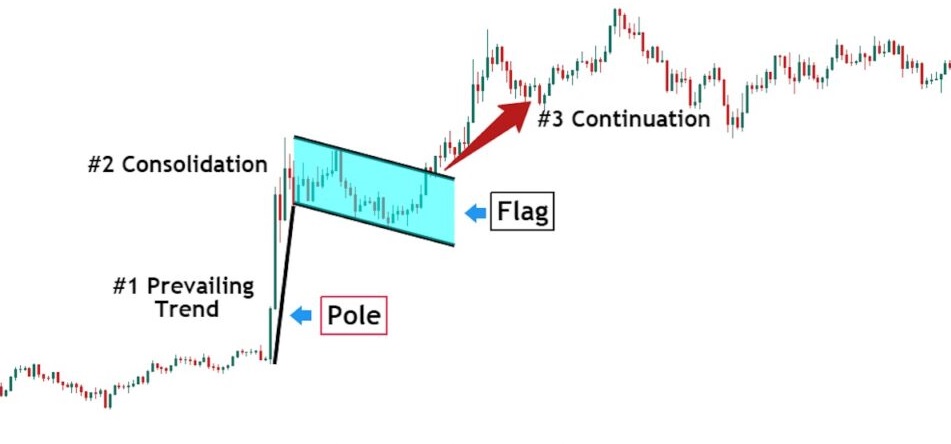 The Bullish Flag pattern is a continuation pattern in technical analysis that signals a potential trend continuation from an uptrend to an uptrend. It is identified by a short-term consolidation after a strong price move, forming a rectangular shape with two parallel trendlines. The pattern takes time to form and can take several days or weeks.
The Bullish Flag pattern is typically characterized by a sharp price move up (the flagpole) followed by a consolidation period (the flag), which forms a rectangle shape. The upper trendline of the rectangle acts as resistance, while the lower trendline acts as support. This consolidation period indicates that the buyers are taking a pause after the strong move up and may be preparing for another leg higher.
Traders typically look for a confirmation of the pattern when the price breaks through the upper trendline on higher-than-average trading volume. This breakout is usually followed by an uptrend continuation, with traders setting a price target based on the height of the flagpole.
It is important to note that not all Bullish Flag patterns will result in a trend continuation, and traders should use caution and consider other technical indicators and market factors before making any trading decisions based solely on this pattern. |