What is Money Flow Index ?
Money Flow Index
 The Money Flow Index (MFI) is a technical analysis indicator used to measure the momentum of a particular asset and to identify potential trend reversals. The MFI is based on the idea that volume, combined with price movement, can be used to predict changes in market trends.
The MFI is calculated by taking the ratio of the positive money flow and the negative money flow over a given period. The positive money flow is calculated by multiplying the typical price of an asset by the volume, and then summing this value for all periods where the price of the asset has increased. The negative money flow is calculated in the same way, but for periods where the price of the asset has decreased.
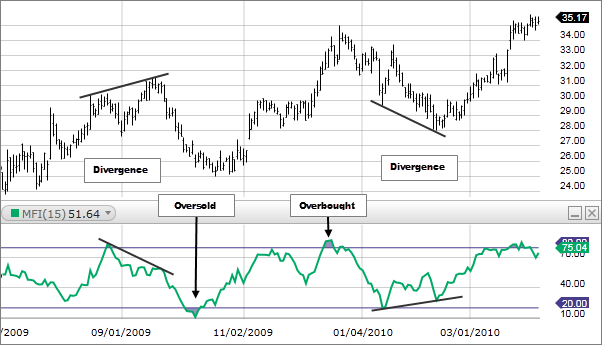
The resulting value is then normalized using a scale of 0 to 100, with values above 80 indicating that an asset is overbought and may be due for a correction, and values below 20 indicating that an asset is oversold and may be due for a reversal.
Traders and investors can use the MFI to identify potential trend reversals or to confirm the strength of a trend. For example, if an asset is trending upwards and the MFI is also trending upwards, this may indicate that the bullish trend is strong and likely to continue. Conversely, if an asset is trending downwards and the MFI is also trending downwards, this may indicate that the bearish trend is strong and likely to continue.
It is important to note that the MFI should not be used in isolation and should be used in conjunction with other technical analysis tools and indicators to confirm trading signals and identify potential market movements. |