What is Moving Average Crossover?
Moving Average Crossover
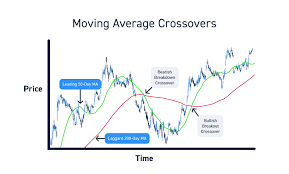 A Moving Average Crossover is a popular technical analysis trading strategy that involves using two or more moving averages to generate buy or sell signals. This strategy is based on the idea that when two different moving averages with different time periods intersect, it can signal a potential change in trend.
The most common type of Moving Average Crossover involves using two moving averages of different time periods. For example, a 50-day Simple Moving Average (SMA) and a 200-day SMA. When the shorter-term moving average (in this case, the 50-day SMA) crosses above the longer-term moving average (the 200-day SMA), it is considered a bullish signal and may indicate a potential upward trend. Conversely, when the shorter-term moving average crosses below the longer-term moving average, it is considered a bearish signal and may indicate a potential downward trend.
Traders and investors may also use exponential moving averages (EMAs) instead of SMAs to generate Moving Average Crossover signals. EMAs give more weight to recent price data and may be more responsive to changes in trend than SMAs.
Moving Average Crossovers can also be used in combination with other technical indicators, such as the Relative Strength Index (RSI) or Moving Average Convergence Divergence (MACD), to confirm signals and identify potential buy or sell opportunities. However, it`s important to note that no trading strategy is foolproof, and traders should always use appropriate risk management techniques to manage their positions. |