What is Relative Strength Index?
Relative Strength Index
 The Relative Strength Index (RSI) is a popular technical analysis oscillator that measures the speed and change of price movements to determine overbought or oversold conditions. The RSI is a momentum indicator, meaning it helps to identify the strength of a trend and whether it is likely to continue or reverse.
The RSI is calculated using the following formula:
RSI = 100 - [100 / (1 + RS)]
where:
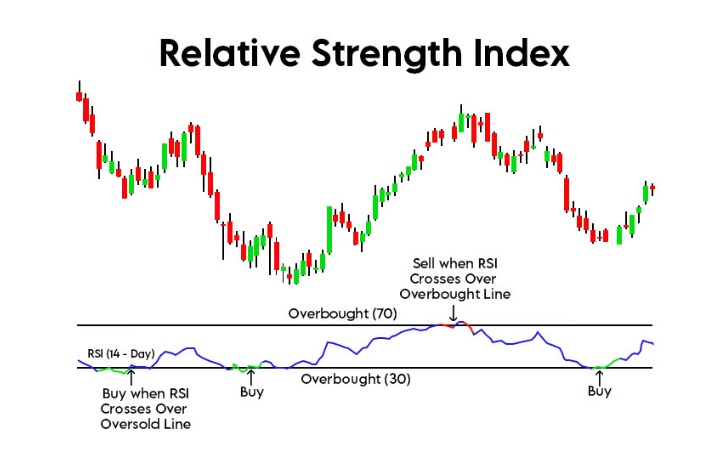
RS = Average Gain / Average Loss over a specified time period (usually 14 periods) The RSI oscillates between 0 and 100, with levels above 70 considered overbought and levels below 30 considered oversold. When the RSI rises above 70, it suggests that the security is overbought and may be due for a price correction or pullback. Conversely, when the RSI falls below 30, it suggests that the security is oversold and may be due for a price rebound or reversal.
Traders and investors can use the RSI to identify potential buy or sell signals. For example, a bullish signal may be generated when the RSI crosses above the oversold level of 30, indicating that the security may be due for a rebound. Similarly, a bearish signal may be generated when the RSI crosses below the overbought level of 70, indicating that the security may be due for a price correction.
The RSI can also be used in combination with other technical analysis tools, such as moving averages, to confirm signals and identify potential trading opportunities. However, it`s important to note that no indicator or trading strategy is foolproof, and traders should always use appropriate risk management techniques when trading the markets. |