What is stochastic indicator?
Stochastic indicator
 The stochastic indicator is a technical analysis tool used in financial trading to measure the momentum of an asset`s price. It was developed by George Lane in the 1950s.
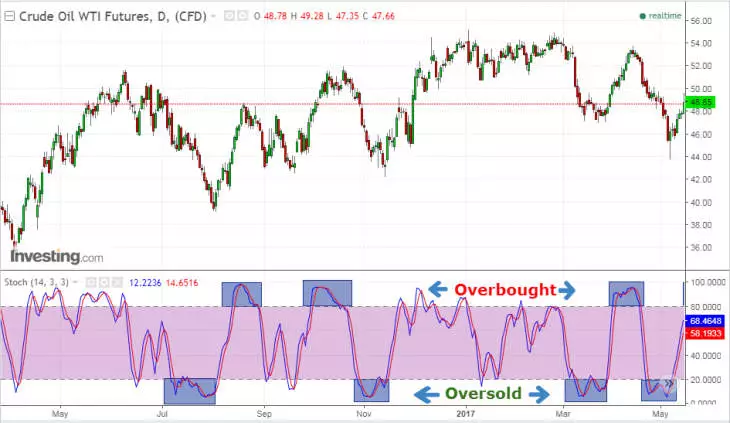
The stochastic indicator compares the current price of an asset to its price range over a certain period of time, typically 14 periods. The indicator consists of two lines: the %K line and the %D line. The %K line is the main line and the %D line is a smoothed version of the %K line.
The stochastic indicator is based on the idea that in an upward trending market, prices tend to close near their high, while in a downward trending market, prices tend to close near their low. The stochastic indicator measures the distance between the current price and the high or low of the price range over the specified period. A reading above 80 indicates that an asset is overbought, while a reading below 20 indicates that an asset is oversold.
Traders use the stochastic indicator to identify potential trend reversals or to confirm the direction of a trend. However, like all technical indicators, the stochastic indicator should not be used in isolation and should be used in conjunction with other indicators and analysis. |