What is the Candlestick Anatomy?
📊 Candlestick Anatomy
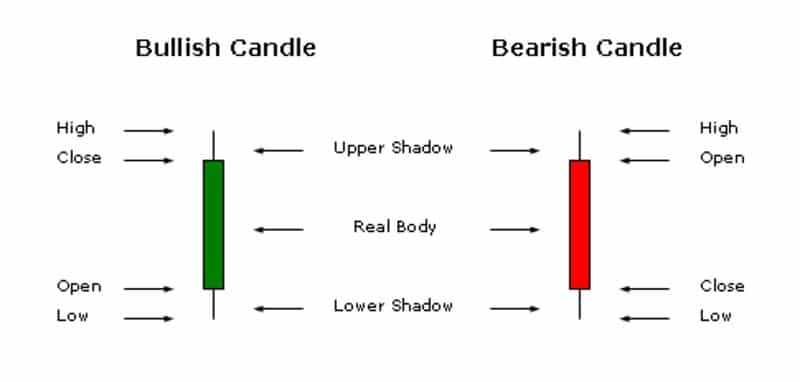
The anatomy of a candlestick chart consists of four main parts:
The body: The body of the candlestick represents the difference between the opening and closing price of an asset over a given period of time. A green (or white) body represents a bullish candle, meaning the closing price is higher than the opening price, while a red (or black) body represents a bearish candle, meaning the closing price is lower than the opening price.
The wick or shadow: The wick or shadow of a candlestick represents the highest and lowest price of the asset during the given period. The upper shadow (wick) represents the highest price, while the lower shadow (wick) represents the lowest price.
The upper and lower tails: The upper and lower tails are the lines above and below the body of the candlestick, respectively. They indicate the range between the highest and lowest price of an asset during the given period.
The opening and closing prices: The opening and closing prices are represented by the top and bottom of the body of the candlestick, respectively. The opening price is usually on the left side of the body, while the closing price is on the right side.
By analyzing the combination of these four elements, traders can gain valuable insights into the movement of an asset, including its trend, volatility, and potential reversal points. Different candlestick patterns can also provide additional information about market sentiment and potential trading opportunities.