What is The Double bottom and top formation?
The Double bottom and top formation
 Double bottom and double top are common technical chart patterns used by traders to identify potential trend reversals in the market.
Double Bottom Formation: A double bottom formation is a bullish reversal pattern that occurs when the price of an asset falls to a certain level, bounces back up, falls again to the same level, and then bounces up again, creating two "valleys" that are roughly equal in price. This pattern indicates that buyers have started to outnumber sellers, and there may be a potential uptrend reversal in the future.
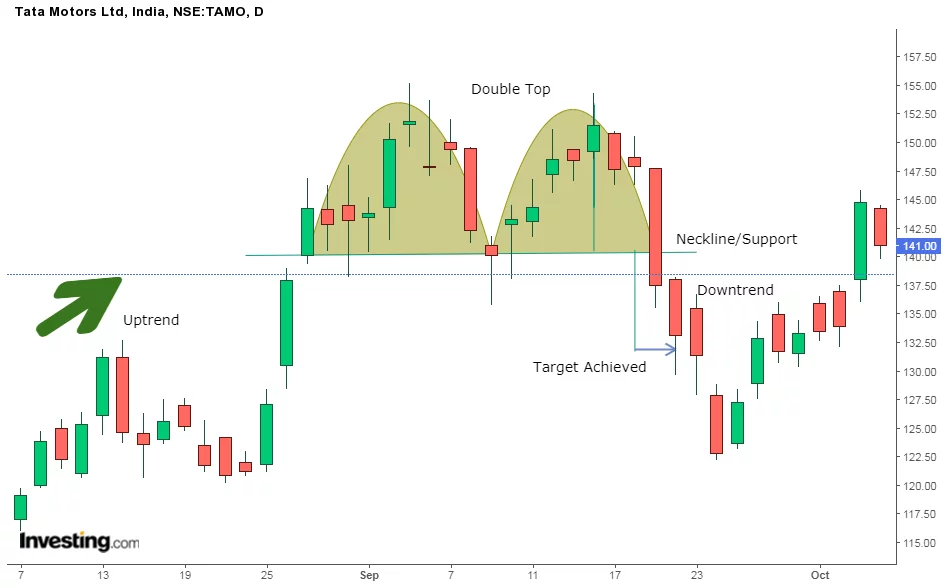
Double Top Formation: A double top formation is a bearish reversal pattern that occurs when the price of an asset rises to a certain level, falls back down, rises again to the same level, and then falls again, creating two "peaks" that are roughly equal in price. This pattern indicates that sellers have started to outnumber buyers, and there may be a potential downtrend reversal in the future.
In both cases, traders usually look for a confirmation signal, such as a breakout above or below the neckline, to confirm that the trend is indeed reversing.
It is important to note that these patterns are not always 100% accurate in predicting trend reversals, and traders should use them in conjunction with other indicators and analysis methods to make informed trading decisions. |