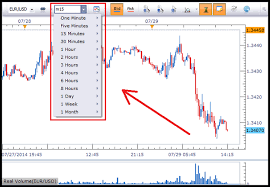
What are the different types of time frames?
Different types of time frames
 There are several different types of time frames that traders can use to analyze the movement of financial assets. Here are some of the most common types of time frames:
Tick charts: Tick charts show the price movement of an asset based on each individual trade or tick. These charts can be useful for short-term traders looking to capture small price movements.
Minute charts: Minute charts show the price movement of an asset over a specified number of minutes, such as 1-minute, 5-minute, or 15-minute intervals. These charts are popular among day traders and can provide valuable insights into short-term trends.
Hourly charts: Hourly charts show the price movement of an asset over hourly intervals. These charts are useful for traders who are interested in short-term trends but prefer a longer time frame than minute charts.
Daily charts: Daily charts show the price movement of an asset over each trading day. These charts are popular among swing traders and can provide a longer-term perspective on the movement of an asset.
Weekly charts: Weekly charts show the price movement of an asset over each week. These charts are useful for traders who are interested in longer-term trends and can help to filter out short-term noise in the market.
Monthly charts: Monthly charts show the price movement of an asset over each month. These charts are popular among long-term investors and can provide a broader perspective on the movement of an asset over time.
Traders can choose the time frame that best suits their trading style and goals, with shorter time frames generally being more appropriate for short-term trading and longer time frames being more appropriate for long-term investing. |
Latest Stock Market Tutorials
| 1. What is Descending Triangle Pattern? |
| 2. What is Bearish Pennant Pattern? |
| 3. What is Bearish Flag Pattern? |
| 4. What is Rising Wedge Pattern? |
| 5. What is Double Top Pattern? |
Free Stock Market Tutorials
| 1. Free Fundamental Analysis Course |
| 2. Free Technical Analysis Course |
| 3. Free Price Action Trading Course |
| 4. Free Futures & Options Course |
IMPORTANT ALERT! Information Posting in this website is only for educational purpose. We are not responsible for losses incurred in Trading based on this information.