📊 Technical Analysis Training in Hyderabad
📈 Technical Analysis Course in Hyderabad
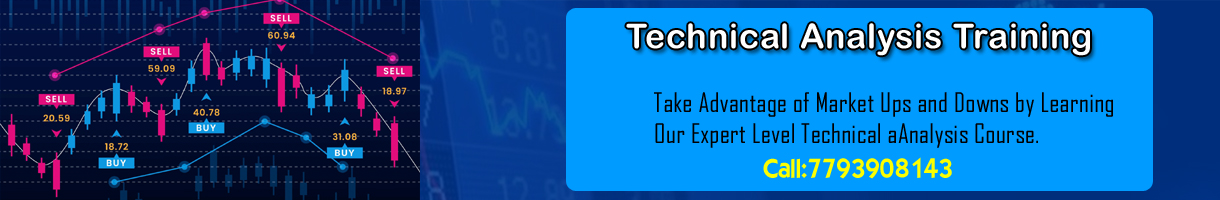
Technical Analysis Course in Hyderabad:
-
Introduction to Technical Analysis
Technical analysis is a method of analyzing financial markets and securities that uses past price and volume data to identify patterns and trends. The goal of technical analysis is to forecast future price movements based on historical patterns, and to make investment decisions based on this analysis. -
WHAT IS TECHNICAL ANALYSIS?
Technical analysts use charts, indicators, and statistical tools to identify patterns like support/resistance, trend lines, and chart patterns such as head and shoulders or triangles. -
PRINCIPLES OF TECHNICAL ANALYSIS
Technical indicators like moving averages, RSI, stochastic oscillators help identify trends and potential reversals. Fundamental data may also support analysis. - CHARTS TRADING VIEW & CHARTINK
- TYPES OF INDICATORS & OSCILLATORS
-
ACCUMULATION & DISTRIBUTION INDICATOR
Measures money flow into/out of an asset to predict price movement. -
AROON OSCILLATOR
Identifies trends and momentum strength using Aroon Up and Down. -
RELATIVE STRENGTH INDEX
Measures strength and momentum to identify overbought/oversold conditions. -
AVERAGE DIRECTIONAL INDEX
Measures trend strength and direction. -
BOLLINGER BANDS
Measures volatility using moving averages and standard deviation. -
COMMODITY CHANNEL INDEX
Identifies overbought/oversold and momentum. -
MOMENTUM
Measures speed of price movement. -
MONEY FLOW INDEX
Uses price + volume to detect buying/selling pressure. -
MACD (Moving Average Convergence Divergence)
Identifies trend direction and signals. - Strategies based on indicators with Back Testing
📘 WHAT IS TECHNICAL ANALYSIS Training?
Technical analysis training is a program or course designed to teach individuals how to analyze financial markets using technical analysis. The training may be offered by financial institutions, online platforms, or independent educators.
The training typically covers the basics of technical analysis, such as charting techniques, technical indicators, and pattern recognition. Participants may learn how to use various software tools and trading platforms to conduct technical analysis, as well as how to interpret the results of their analysis.
Advanced technical analysis training may cover more complex topics such as market psychology, advanced technical indicators, and trading strategies. Some training programs may also include simulations or live trading sessions to provide participants with practical experience in applying their knowledge to real-world trading scenarios.
Technical analysis training can be beneficial for anyone interested in trading financial markets, including individual investors, traders, and financial professionals. By learning how to conduct technical analysis, individuals can better understand market trends and make informed decisions about when to buy and sell assets.
Technical analysis training programs can vary in terms of their duration, cost, and content. Some training programs may be available online, while others may be held in-person. Online programs may offer the advantage of flexibility, allowing participants to learn at their own pace and on their own schedule. In-person programs, on the other hand, may provide more opportunities for interaction with instructors and fellow participants.
The cost of technical analysis training can also vary widely. Some programs may be relatively inexpensive, while others may be quite costly. It's important to carefully evaluate the cost of the program against the potential benefits to determine whether it's a worthwhile investment.
In addition to learning technical analysis techniques, participants in technical analysis training programs may also gain insights into trading psychology and risk management. These topics are important for anyone who wants to be successful in trading financial markets, as they can help individuals make better decisions and avoid common pitfalls.
Overall, technical analysis training can be a valuable investment for anyone interested in trading financial markets. By learning how to analyze market trends and patterns, individuals can gain a deeper understanding of the markets and make more informed decisions about when to buy and sell assets.
Technical analysis training programs may also cover different types of financial markets, such as stocks, forex, options, and futures. Some programs may focus on a specific market or asset class, while others may cover multiple markets. It's important to choose a program that aligns with your trading interests and goals.
The content of technical analysis training programs may also vary depending on the level of expertise of the target audience. Some programs may be designed for beginners, while others may be more advanced and assume a basic understanding of technical analysis concepts.
Some technical analysis training programs may also offer certifications or accreditation, which can be useful for demonstrating knowledge and expertise to potential employers or clients.
In addition to formal technical analysis training programs, there are also many resources available online for individuals who want to learn more about technical analysis. These may include books, articles, videos, and webinars. While these resources may not provide as structured and comprehensive a learning experience as a formal training program, they can still be a valuable source of information and education.
Ultimately, technical analysis training can be a valuable tool for anyone interested in trading financial markets. By learning how to analyze market trends and patterns, individuals can make more informed trading decisions and potentially increase their profitability. options and futures trading course. free futures trading course. fundamentals of trading energy futures & options. futures trading course
Overall, technical analysis training helps traders make better decisions and improve results.
Stock market training in Ameerpet,
Futures & Options Training,
Technical analysis online training,
Stock market technical analysis course,
Advanced technical analysis course,
Best technical analysis course
options and futures trading course. free futures trading course. fundamentals of trading energy futures & options. futures trading course