What is Descending Triangle Pattern?
Descending Triangle Pattern
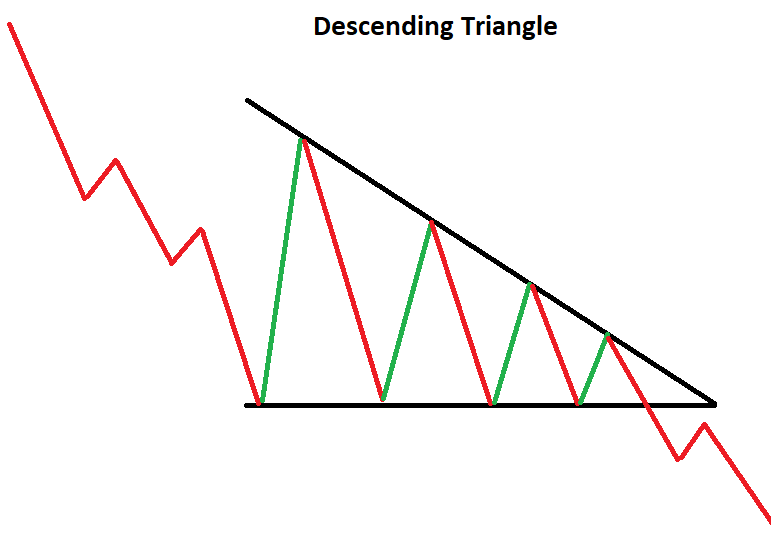
 The Descending Triangle pattern is a bearish chart pattern in technical analysis that signals a potential trend reversal from an uptrend to a downtrend. It is formed by a series of lower highs that converge towards a horizontal support line, creating a triangle-shaped pattern that resembles a staircase.
Traders typically identify the Descending Triangle pattern by drawing a trendline connecting the lower highs and a horizontal support line at the same level. The pattern is confirmed when the price breaks below the support line on higher-than-average trading volume.
Traders often use the Descending Triangle pattern as a signal to sell, with a price target set based on the distance from the support line to the highest point of the triangle. It is important to note that not all Descending Triangle patterns will result in a trend reversal, and traders should use caution and consider other technical indicators and market factors before making any trading decisions based solely on this pattern. |
Latest Stock Market Tutorials
| 1. What is Descending Triangle Pattern? |
| 2. What is Bearish Pennant Pattern? |
| 3. What is Bearish Flag Pattern? |
| 4. What is Rising Wedge Pattern? |
| 5. What is Double Top Pattern? |
Free Stock Market Tutorials
| 1. Free Fundamental Analysis Course |
| 2. Free Technical Analysis Course |
| 3. Free Price Action Trading Course |
| 4. Free Futures & Options Course |
IMPORTANT ALERT! Information Posting in this website is only for educational purpose. We are not responsible for losses incurred in Trading based on this information.