What are the types of Trend?
Types of Trend
 There are three types of trends in the stock market: uptrend, downtrend, and sideways trend (also known as a horizontal or range-bound trend).
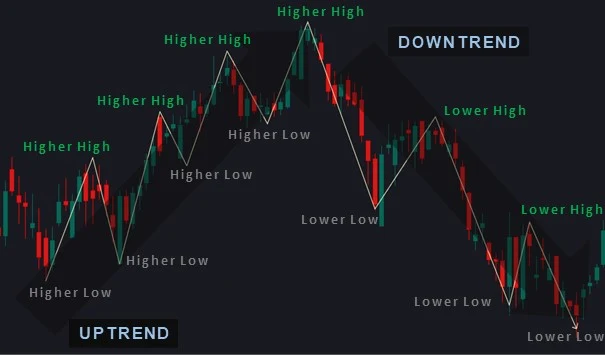
Uptrend: An uptrend occurs when the price of an asset is making higher highs and higher lows over time, indicating that there is increasing buying pressure and demand for the asset. This can be seen on a price chart as a series of ascending peaks and troughs.
Downtrend: A downtrend occurs when the price of an asset is making lower lows and lower highs over time, indicating that there is increasing selling pressure and decreasing demand for the asset. This can be seen on a price chart as a series of descending peaks and troughs.
Sideways trend: A sideways trend occurs when the price of an asset is moving within a range, with no clear direction or trend. This can be seen on a price chart as a series of peaks and troughs that are roughly equal in height and not trending up or down.
Identifying and understanding the type of trend can help traders and investors make informed trading decisions, such as entering or exiting positions or adjusting their risk management strategies. It is important to note that trends can be short-term, intermediate-term, or long-term, and can change direction or strength over time. Therefore, traders and investors should use proper risk management techniques and have a well-defined trading plan when trading based on trends. |
Latest Stock Market Tutorials
| 1. What is Descending Triangle Pattern? |
| 2. What is Bearish Pennant Pattern? |
| 3. What is Bearish Flag Pattern? |
| 4. What is Rising Wedge Pattern? |
| 5. What is Double Top Pattern? |
Free Stock Market Tutorials
| 1. Free Fundamental Analysis Course |
| 2. Free Technical Analysis Course |
| 3. Free Price Action Trading Course |
| 4. Free Futures & Options Course |
IMPORTANT ALERT! Information Posting in this website is only for educational purpose. We are not responsible for losses incurred in Trading based on this information.