What is Trading Range?
Trading Range
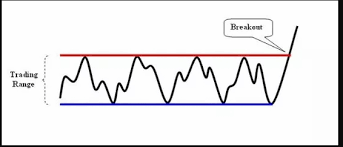
 A trading range is a period of time when an asset`s price moves within a relatively narrow range or a specific price range, without establishing a clear trend in either direction. During a trading range, the asset`s price tends to fluctuate between a support level (the lower boundary) and a resistance level (the upper boundary).
Traders often use technical analysis to identify trading ranges and look for potential trading opportunities within them. They may use a variety of indicators and tools, such as moving averages, oscillators, and trend lines, to identify support and resistance levels and to help determine when to buy or sell an asset.
Trading ranges can occur in any market, but they are particularly common in sideways or consolidating markets, where there is no clear trend in either direction. Trading ranges can last for a few days, weeks, or even months, and may be influenced by a variety of factors, such as market sentiment, economic news, and company-specific events.
It is important to note that trading ranges can be difficult to trade, as prices may remain range-bound for an extended period, and breakouts from the range can be unpredictable. As with any trading strategy, traders should use proper risk management techniques and have a well-defined trading plan before entering a trade in a trading range. |
Latest Stock Market Tutorials
| 1. What is Descending Triangle Pattern? |
| 2. What is Bearish Pennant Pattern? |
| 3. What is Bearish Flag Pattern? |
| 4. What is Rising Wedge Pattern? |
| 5. What is Double Top Pattern? |
Free Stock Market Tutorials
| 1. Free Fundamental Analysis Course |
| 2. Free Technical Analysis Course |
| 3. Free Price Action Trading Course |
| 4. Free Futures & Options Course |
IMPORTANT ALERT! Information Posting in this website is only for educational purpose. We are not responsible for losses incurred in Trading based on this information.