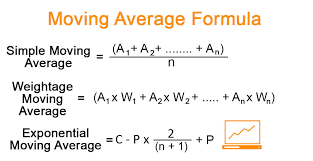
What is a Simple Moving Average?
A Simple Moving Average
 A Simple Moving Average (SMA) is a commonly used technical indicator that calculates the average price of a security over a specified number of periods. It is a basic form of moving average that gives equal weight to each data point in the calculation.
To calculate a simple moving average, the closing prices of a security are added up over a specified number of periods and then divided by the number of periods. For example, a 20-day simple moving average would add up the closing prices of a security for the past 20 days and divide the sum by 20.
The resulting value is plotted on a chart, creating a line that shows the average price over the specified time period. This line can be used to identify trends and potential support and resistance levels.
Simple moving averages are often used in technical analysis to identify changes in trend and potential trading opportunities. When the price of a security is above its moving average, it is generally considered to be in an uptrend, while a price below the moving average is considered to be in a downtrend.
Traders and investors may also use multiple simple moving averages, such as a 50-day and a 200-day moving average, to identify crossovers and potential buy or sell signals. For example, a bullish signal may be generated when the shorter-term moving average crosses above the longer-term moving average, while a bearish signal may be generated when the shorter-term moving average crosses below the longer-term moving average. |
Latest Stock Market Tutorials
| 1. What is Descending Triangle Pattern? |
| 2. What is Bearish Pennant Pattern? |
| 3. What is Bearish Flag Pattern? |
| 4. What is Rising Wedge Pattern? |
| 5. What is Double Top Pattern? |
Free Stock Market Tutorials
| 1. Free Fundamental Analysis Course |
| 2. Free Technical Analysis Course |
| 3. Free Price Action Trading Course |
| 4. Free Futures & Options Course |
IMPORTANT ALERT! Information Posting in this website is only for educational purpose. We are not responsible for losses incurred in Trading based on this information.