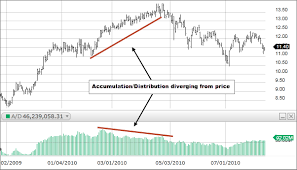
What is ACCULMULATION & DISTRIBUTION INDICATOR?
ACCULMULATION & DISTRIBUTION INDICATOR
 The Accumulation/Distribution (A/D) indicator is a technical analysis tool that helps traders and investors determine the strength of buying and selling pressure for a particular asset. The A/D indicator is based on the assumption that the volume of trading activity for an asset reflects the overall strength of buying and selling pressure.
The A/D indicator calculates a cumulative total of the volume traded for an asset, with a positive value indicating buying pressure and a negative value indicating selling pressure. The indicator takes into account the price movement of the asset, assigning more weight to days where the price closes near the high or low of the day, depending on whether the indicator is in accumulation or distribution mode.
In accumulation mode, the A/D indicator reflects the net buying pressure for the asset, with the indicator trending upwards as buying pressure increases. In distribution mode, the A/D indicator reflects the net selling pressure for the asset, with the indicator trending downwards as selling pressure increases.
Traders and investors can use the A/D indicator to confirm the strength of a trend or to identify potential trend reversals. For example, if an asset is trending upwards but the A/D indicator is trending downwards, this may indicate that the buying pressure is weakening and that a trend reversal may be imminent.
It is important to note that the A/D indicator should not be used in isolation and should be used in conjunction with other technical analysis tools and indicators to confirm trading signals and identify potential market movements. |
Latest Stock Market Tutorials
| 1. What is Descending Triangle Pattern? |
| 2. What is Bearish Pennant Pattern? |
| 3. What is Bearish Flag Pattern? |
| 4. What is Rising Wedge Pattern? |
| 5. What is Double Top Pattern? |
Free Stock Market Tutorials
| 1. Free Fundamental Analysis Course |
| 2. Free Technical Analysis Course |
| 3. Free Price Action Trading Course |
| 4. Free Futures & Options Course |
IMPORTANT ALERT! Information Posting in this website is only for educational purpose. We are not responsible for losses incurred in Trading based on this information.