What is Average True Range Indicator?
📊 Average True Range Indicator
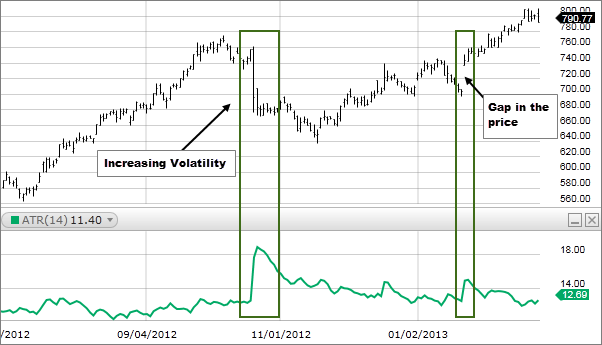
The Average True Range (ATR) indicator is a technical analysis tool that measures the volatility of an asset by calculating the average range of price movement over a certain period of time. Developed by J. Welles Wilder, the ATR indicator helps traders identify potential trend reversals, as well as levels of support and resistance.
The ATR indicator is calculated as the average of the true range over a certain number of periods. The true range is the greatest of the following:
The difference between the current period`s high and low.
The absolute value of the difference between the current period`s high and the previous period`s close.
The absolute value of the difference between the current period`s low and the previous period`s close.
The ATR indicator is typically displayed as a line chart, with higher values indicating greater volatility and lower values indicating less volatility. Traders may use the ATR indicator to set stop-loss levels, as well as to determine the potential profit and loss of a trade based on the current volatility of the asset.