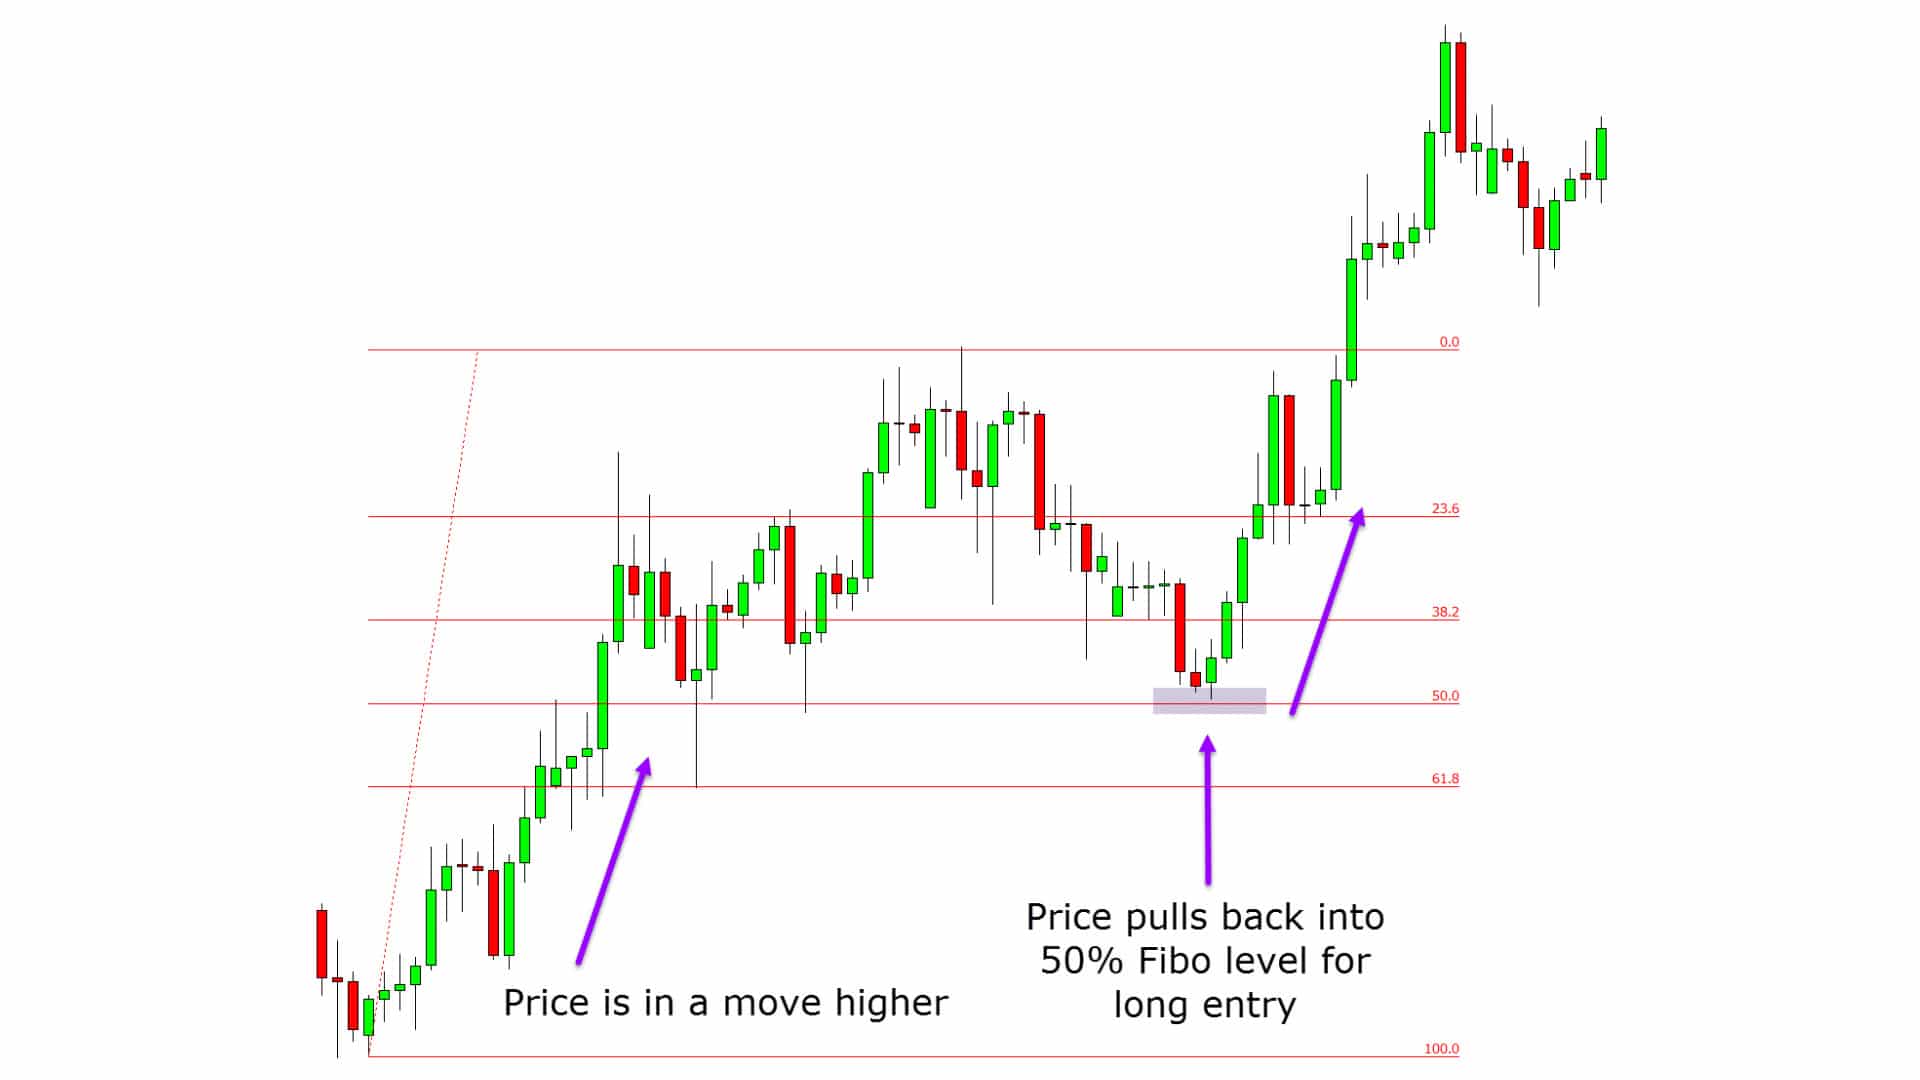
What is Fibonacci Retracements?
Fibonacci Retracements
 Fibonacci retracements are a popular technical analysis tool that is used to identify potential levels of support and resistance in a security`s price trend. The tool is based on the Fibonacci sequence, a series of numbers in which each number is the sum of the two preceding numbers: 0, 1, 1, 2, 3, 5, 8, 13, 21, 34, and so on.
In Fibonacci retracements, traders use horizontal lines to mark levels on a chart where the price may potentially reverse or consolidate. These levels are calculated using the Fibonacci ratios of 23.6%, 38.2%, 50%, 61.8%, and 100%.
The Fibonacci retracements are plotted by identifying two points on a price chart: the high point (the swing high) and the low point (the swing low). The tool then draws horizontal lines at the Fibonacci levels between these two points.
Traders and investors can use Fibonacci retracements to identify potential levels of support and resistance. When the price of the security retraces to one of the Fibonacci levels, it may indicate a potential reversal or consolidation. For example, if the price retraces to the 61.8% level, it may indicate a strong level of support or resistance.
Fibonacci retracements can also be used in combination with other technical analysis tools, such as trend lines, moving averages, or oscillators, to confirm signals and identify potential trading opportunities. However, it`s important to note that no indicator or trading strategy is foolproof, and traders should always use appropriate risk management techniques when trading the markets. |
Latest Stock Market Tutorials
| 1. What is Descending Triangle Pattern? |
| 2. What is Bearish Pennant Pattern? |
| 3. What is Bearish Flag Pattern? |
| 4. What is Rising Wedge Pattern? |
| 5. What is Double Top Pattern? |
Free Stock Market Tutorials
| 1. Free Fundamental Analysis Course |
| 2. Free Technical Analysis Course |
| 3. Free Price Action Trading Course |
| 4. Free Futures & Options Course |
IMPORTANT ALERT! Information Posting in this website is only for educational purpose. We are not responsible for losses incurred in Trading based on this information.