What is the Harami Pattern Pattern?
📊 Harami Pattern Pattern
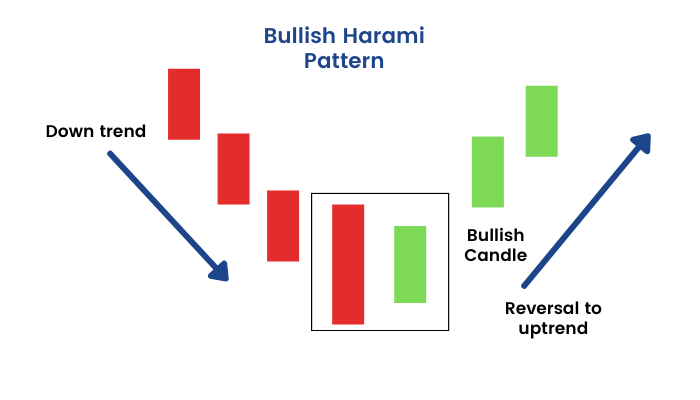
The harami pattern is a candlestick chart pattern that is used in technical analysis to signal a potential trend reversal. The pattern consists of two candlesticks, with the first candlestick being a long candlestick, and the second being a small candlestick that is completely engulfed by the first candlestick.
There are two types of harami patterns: bullish harami and bearish harami.
A bullish harami occurs when a long red (bearish) candlestick is followed by a small green (bullish) candlestick that is completely engulfed by the previous candlestick`s body. This is interpreted as a bullish signal, suggesting that the selling pressure has been overcome and that a potential trend reversal may be imminent.
On the other hand, a bearish harami occurs when a long green (bullish) candlestick is followed by a small red (bearish) candlestick that is completely engulfed by the previous candlestick`s body. This is interpreted as a bearish signal, suggesting that the buying pressure has been overcome and that a potential trend reversal may be imminent.
The strength of the harami pattern can be enhanced if the small candlestick is a doji, indicating indecision in the market. Additionally, traders may look for other technical indicators or market factors to confirm the potential trend reversal signaled by the harami pattern before making any trading decisions.
It`s important to note that the harami pattern is not a guarantee of a trend reversal and should be considered in the context of other technical indicators and market factors. Traders should always practice risk management and employ stop-loss orders to limit potential losses.