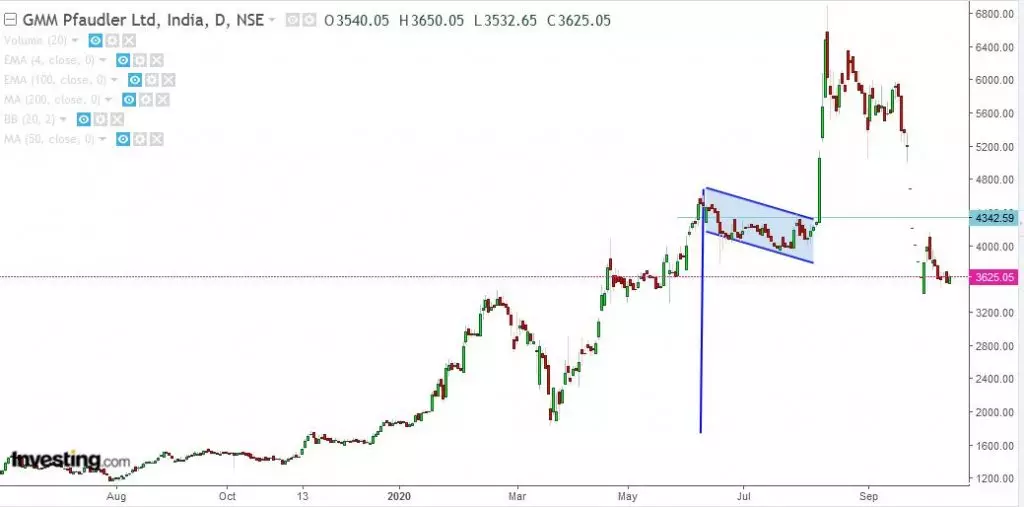
What is The Flag formation?
The Flag formation
 The flag formation is a common technical chart pattern that occurs when the price of an asset experiences a sharp price movement, followed by a period of consolidation or sideways movement. The pattern resembles a flag on a flagpole, hence the name "flag formation."
The flag formation is usually characterized by two parallel trend lines, with the upper trend line acting as a resistance level and the lower trend line acting as a support level. The price movement that forms the flagpole can be either a sharp upward movement (bullish flag) or a sharp downward movement (bearish flag).
After the flagpole formation, the price of the asset typically consolidates within the parallel trend lines for a period of time, creating the flag portion of the pattern. This consolidation phase is often accompanied by lower trading volumes and can be used to identify potential support and resistance levels.
Traders often look for a breakout from the flag formation as a potential trading opportunity. A breakout above the upper trend line of the flag is considered a bullish signal, while a breakout below the lower trend line of the flag is considered a bearish signal.
It is important to note that false breakouts can occur, and traders should use proper risk management techniques and have a well-defined trading plan before entering a trade based on a flag formation.
|
Latest Stock Market Tutorials
| 1. What is Descending Triangle Pattern? |
| 2. What is Bearish Pennant Pattern? |
| 3. What is Bearish Flag Pattern? |
| 4. What is Rising Wedge Pattern? |
| 5. What is Double Top Pattern? |
Free Stock Market Tutorials
| 1. Free Fundamental Analysis Course |
| 2. Free Technical Analysis Course |
| 3. Free Price Action Trading Course |
| 4. Free Futures & Options Course |
IMPORTANT ALERT! Information Posting in this website is only for educational purpose. We are not responsible for losses incurred in Trading based on this information.