What is the History of the Japanese Candlestick?
History of the Japanese Candlestick
 Japanese candlestick charting is a popular method used by traders to analyze the movement of financial assets, such as stocks, currencies, and commodities. The history of Japanese candlestick charting dates back to the 17th century, when a Japanese rice trader named Munehisa Homma developed a method to analyze the price movement of rice in the Osaka rice market.
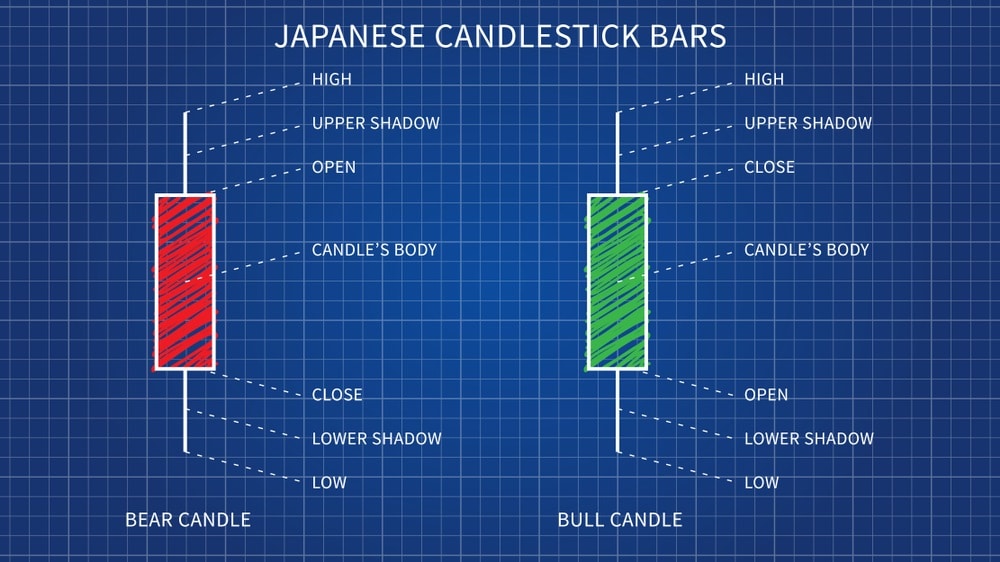
Homma`s method involved tracking the opening and closing prices of rice over a certain period of time and using this information to identify patterns in the price movement. Homma used a system of candlestick charts to visualize the price movement, with each candle representing a specific period of time and showing the opening, closing, high, and low prices of the asset.
Homma`s method of charting the price movement of rice proved to be highly effective, and other traders soon began to adopt his method. Over time, Japanese candlestick charting became a popular method of analyzing the movement of financial assets in Japan and was eventually introduced to the Western world in the 1980s.
Today, Japanese candlestick charting is widely used by traders and investors around the world and has become a key tool in technical analysis. The popularity of Japanese candlestick charting is due in part to its simplicity and ease of use, as well as its ability to provide valuable insights into the movement of financial assets. |
Latest Stock Market Tutorials
| 1. What is Descending Triangle Pattern? |
| 2. What is Bearish Pennant Pattern? |
| 3. What is Bearish Flag Pattern? |
| 4. What is Rising Wedge Pattern? |
| 5. What is Double Top Pattern? |
Free Stock Market Tutorials
| 1. Free Fundamental Analysis Course |
| 2. Free Technical Analysis Course |
| 3. Free Price Action Trading Course |
| 4. Free Futures & Options Course |
IMPORTANT ALERT! Information Posting in this website is only for educational purpose. We are not responsible for losses incurred in Trading based on this information.