What is Double Bottom Pattern?
📊 Double Bottom Pattern
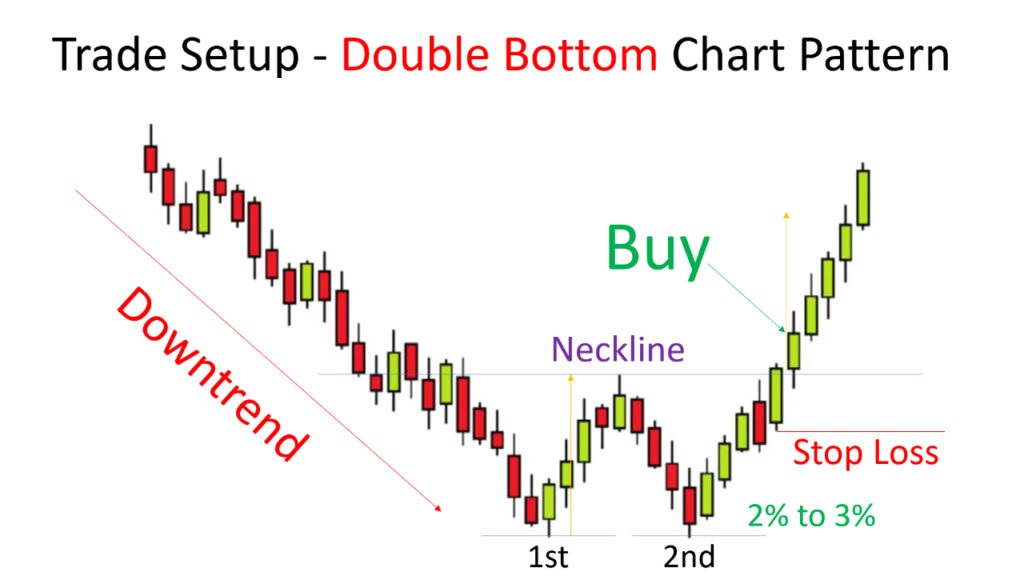
The Double Bottom Pattern is a bullish reversal pattern in technical analysis that signals a potential trend reversal from a downtrend to an uptrend. The pattern is identified by two consecutive bottoms at approximately the same level, separated by a peak in the middle. The pattern takes time to form and can take several weeks or months.
When a stock price falls to a certain level and bounces back up, it forms the first bottom. The price then declines again and reaches the same level as the first bottom, forming the second bottom. The middle peak is formed when the price attempts to recover but fails to break through the resistance level, creating a resistance area that forms the top of the pattern.
Traders typically look for a confirmation of the pattern when the price breaks through the resistance level on higher-than-average trading volume. This breakout is usually followed by an uptrend continuation, with traders setting a price target based on the height of the pattern.
It is important to note that not all double bottom patterns will result in a trend reversal, and traders should use caution and consider other technical indicators and market factors before making any trading decisions based solely on this pattern.
